
Metallic Rebellion: Doré Duré?

Executive Summary
- It is a distinctive twist of human optimism that we value a recent loss more keenly than a larger prior or future gain.
- Reactions to the one-day movements in gold and silver prices on Oct 21 illustrate this quirk in our nature.
- Spot gold declined by –5.3%. Spot silver shed –7.1%. The consensus reaction was fear and suspicion directed toward commodities that had posted record nominal spot price highs in the days before: $4,381 (Oct 20) and $54.48 (Oct 17), respectively.
- Of course it is true these are large daily price declines. It is also true that, more than a month ago, prompt Oct-25 CMX gold was at $3,695 (then already +$570 above its rising 200-day average, or +18% above longer-run support) when we published a caution with respect to the already-evident parabolic price path for spot gold.
- Our note warned: “a slump in gold and oil prices today and in coming days may surprise and confuse investors expecting the opposite outcome with high conviction. Given this terrain, sharp traders will test the strength of the gold and oil markets by selling Oct-25 futures contracts. If these downside probes find weak hands, they may scare recent length to exit and book gains before imminent expiry dates” (Sharp elbows, weak hands: potential tumble in gold and oil, 17-Sep-2025).
- Following the Oct 21 price drawdowns in precious metals, Oct-25 CMX gold is now +$393 (+10.6%) higher on net than when we made our Sep 17 risk management warning. Oct-25 CMX silver ($47.45, Oct 21) is now +$4.90 higher (+11.5%) on net over the same interval.
- Oct-25 CMX gold (GCV5) expires on Wed Oct 29 and has 2,506 lots of remaining open interest to sort in its seven remaining days of existence. Open interest in GCV5 was at 59,554 lots to start Sep 17.
- Significantly higher gold and silver prices most likely lie ahead. We continue to expect $65+ in spot silver and a run toward $5,000 in spot gold before the end of 2026 and probably sooner. It is highly unlikely this historic cycle for precious metals will post its price peaks in 4Q2025.
- But from here the forward price paths cannot and will not be smooth. High price volatility must be expected and managed. The high price volatility is rooted in physical production cost curves and trackable movements of physical inventory. The volatility is not solely an artifact of paper futures and options trading. It is not disconnected from the physical world.
Commentary
A month ago, we cautioned to be on guard for the increasing risk of corrections in gold and oil (Sharp elbows, weak hands: potential tumble in gold and oil, 17-Sep-2025). In that strategy note, we also restated our high conviction that gold would reach $4,000 before June 2026. In fact, the gold price accomplished the task in 21 calendar days (Oct 8).
Also in mid-September 2025, when spot silver was priced at $41.56, we reiterated our case for why silver would soon take out the all-time nominal price high just below $50 (From Bars to Boards: Silver finds its assembly language in AI-driven capex, 16-Sep-2025). It took 23 calendar days for the silver market to achieve the milestone (Oct 9).
Looking forward, we continue to expect spot silver to reach and exceed $65 before the end of 2026 and probably sooner on fundamental economics driven by global capex in AI and electrification. The recent price action in cash gold markets and associated futures and options suggests to us that spot gold will probably exceed $5,000 before this historic cycle in precious metals ends. The 2020s cyclical peaks for gold and silver are highly unlikely to be a 4Q2025 event.
To be crystal clear, these forecasts mean we expect spot gold and silver prices to advance by at least another +25 percent from current levels within the next 14 months. Because of the effects of operating leverage, the expected commodity price gains imply a diversified global basket of miners’ shares (e.g., GDX) is likely to gain in value by at least another +50 percent over the same time frame.
If our assessments are correct, the present corrections in price—while likely still incomplete—offer a buying opportunity in the physical and paper commodities and the related equities.
So, our answer to the question posed by this essay’s title is yes, gold’s historic, once-in-a-generation rally is still intact and durable. Doré is duré.
Likewise, silver’s historic ascent has more room to run. Perhaps far more room to run.
Durable if Volatile — But How Much More Upside?
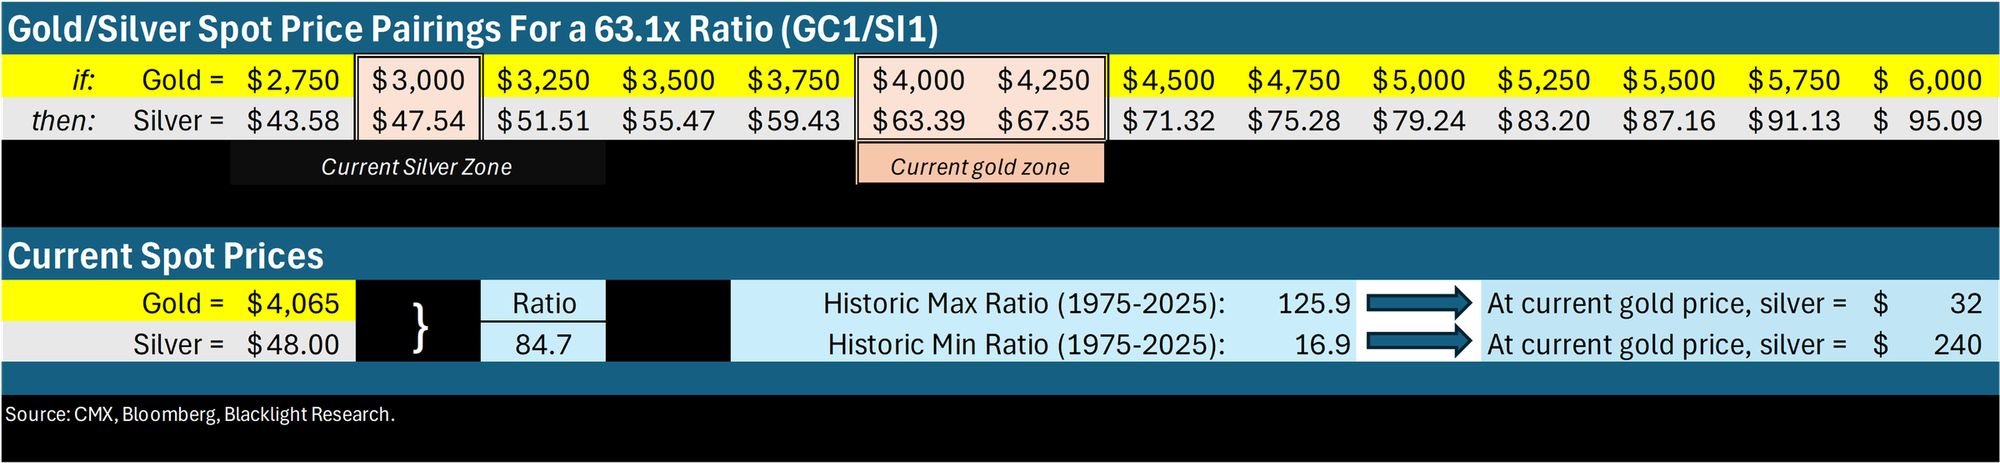
As the table below shows, silver’s spot price risk remains materially and asymmetrically skewed to the upside relative to gold prices. Over the past half century of CMX futures trading, the ratio of prompt gold to silver futures prices (GC1/SI1) has averaged 63.1x at daily closes in a range of 16.9x to 125.9x. At the GC1 closing price following the Oct 21 decline ($4,088), a reversion to the historic mean price ratio would yield an SI1 price at $64.79. Similarly, the Oct 21 SI1 closing price translates to a GC1 price at $3,010 if silver loses no value and GC1 does all the price work from here. We believe reversion to the historic mean ratio (and lower) is highly likely. We continue to expect this outcome to arrive through price advances in both commodities, with silver outperforming gold in percentage terms (Quicksilver gets quicker: long silver trade is now activated, 5-Jun-2025).
But our investment process should not expect the coming net price advances to be smooth.
Two dynamics now define gold and silver price discovery. First, high volatility is now the regime, not a temporary revulsion. Second, high volatility is rooted in production cost economics interlaced across multiple metals and in day-to-day clearing of specific physical inventory transactions, not solely the shifting sentiments of paper-only investors.
Investment strategies too heavily reliant on momentum will be flummoxed by this physically dominated, higher-vol regime.
The winning investment strategies for precious metals will tolerate higher volatility by necessity, while prudently monitoring physical stock movements into factories and vaults.
A core and crucial concept: silver stocks are getting captured and used in physical markets. It’s auction economics. Bids surge to whatever price is required, today, to persuade a seller to dislodge a warrant from their holdings, today.
Once any given contest for any given quantity of stock is completed and cleared, the bid relaxes until the next contest begins and bids surge again. Importantly, the bidders are largely price insensitive given the relatively infinitesimal size of silver’s cost as a proportion of total cost in their use cases (e.g., data centers and electric vehicles).
These economic forces are transparently visible in the exchange stocks data from multiple continents.
In Asia, take note of silver stocks on warrant through the Shanghai Futures Exchange (SFE), for example. According to SFE, the inventory level drew by –106,488 kg (–12% DoD) on Oct 21 and by another –57,574 kg (–8% DoD) on Oct 22. Stocks have drawn every day since Oct 9 when trading resumed after Golden Week. The cumulative on-warrant stock decline since Oct 8 is –500,594 kg (–42%).
Or consider the movements of silver bullion through the CMX warehouses in North America. Total CMX silver stocks drew by 2.635 million ounces on Oct 21 (–0.5% DoD), according to the exchange. Withdrawal of “eligible” stocks (inventories that meet exchange metal specs but are not registered for delivery) accounted for more than 75% of the Oct 21 one-day decline in CMX silver stocks.
Taking a broader view, the net draw in CMX silver inventory began on Oct 6. Since then, total silver stocks in CMX warehouses have declined by 28.0 million ounces (–5.3%). Registered stocks (available for delivery) account for more than 19 million ounces (68%) of the draw.
Stepping back even further, CMX registered silver stocks have been in a declining trend since Sep 2. Between then and now, they have drawn from 200.88 million ounces to 170.64 million ounces (–30.2 million ounces, –15%).
It is these bid-driven movements to dislodge and capture physical inventory, from both exchange registration and eligible status, for both manufacturing and investment purposes, that is causing the observed increases in realized and implied volatility across silver futures (chart below).
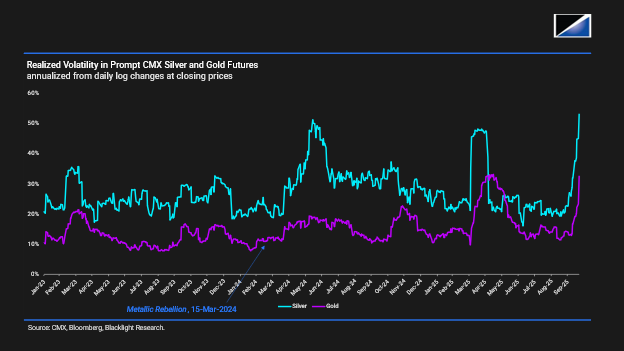
Realized volatility: by our calculations, realized volatility in rolling prompt CMX futures for silver and gold have leapt, respectively, to 53% and 33% (Oct 21) from 38% and 19% a week earlier (Oct 14) and 21% and 13% a month ago (Sep 22). Current readings are high even by commodity standards: they’re about 2x larger than the annualized realized volatility over the two years ending 30-Sep-2025. Such elevated readings typically correspond to midcycle stress as physical balances tighten, underscoring that the current turbulence is systemic, not sentimental.
Implied volatility: according to Bloomberg marks, ATM silver options on the prompt but thinly traded Nov-25 CMX silver futures contract (SIX5) embed 47.6% implied volatility (IV), in a narrowly call-preferred skew with IV surpassing 50% at the 15-deltas. ATM IV on the most active contract, Dec-25 (SIZ5), is marked at 40.6%, with a notable skew in favor of the calls (+3.6 vols at the 25-deltas). The third-most active contract, May-26 (SIK6), features a $60.60 strike price and 37.5% IV for the 25-delta calls against a reference price at $48.80.
Note too that extant silver stocks both on and off exchange are far more ample than implied by media articles about the genuine scarcity of available material in London. Eligible silver stocks sitting in CMX warehouses alone exceed 333 million ounces (Oct 21), according to the exchange.
The issue is spot silver prices a month ago were insufficient to persuade bullion owners to part with their precious store of value. The market discovered the spot prices that were sufficient to dislodge sufficient stocks to meet immediate demand. This process is not over.
The auction in physical gold is more subtle. In recent months, spot price’s surpassing of the 99th percentile on gold’s world mine production cost curve (what industry calls the All-In Sustaining Cost) was a clear tell that marginal supply from the mine face is presently exhausted. If this is true, we should see growth rates in world mine production start to contract. This is precisely what the data show. In turn, physical demand growth is now more dependent on locating extant fabricated gold supply in the form of bullion and coins, then increasingly on jewelry and heirlooms, perhaps passed down from never-met ancestors.
One does not agree to melt down the long-hoarded great-grandparents’ wedding rings at a feeble price. But eventually for every ounce, there is a price.
Last night, we listened to Kai Ryssdal’s Marketplace radio broadcast. In the segment, he interviews Te-Ping Chen, who wrote The Wall Street Journal article “I’m Out of the Office. I’m Digging for Gold.” (Oct 13). Her piece is also an informative anecdotal tell. It profiles Mike Hewlett, a California welder who has recently taken up a new hobby: prospecting for gold in the forests of Mount Shasta, California. He has had about as much success as you’d expect, though it is clear he is having fun. Another prospector profiled in the piece is Chris Spangler, a healthcare administrator for the U.S. Navy now based in Sydney, who brings his two elementary-school aged boys along to pan for gold in Australia’s rivers.
Again, solid family fun in nature. Not likely to be the factor that turns the tide against gold in 2026.
Conclusions
- Seven factors have driven the investment case for gold over the past two years (Metallic Rebellion, 15-Mar-2024; Gold likely works whether inflation slides, ranges, or surges, 15-Mar-2023). Most, if not all, factors remain intact. A peace treaty in the wars over Gaza, Ukraine, or both would be a material change that would require re-evaluation of Driver 2 (Geopolitics of War). But the other factors would likely still offer upward propulsion to gold prices.
- Given Conclusion #1 and the fact that industrial demand of silver is just now ramping up in the context of a multiyear drawdown in silver inventories, it is highly unlikely the historic 2020s cycle for silver and gold will mark its price peaks in 4Q2025.
- Cyclical peak price levels for silver and gold do lie in the future of course, probably before 2028. But peak price levels are likely +25% or more above current spot prices.
- High price volatility for silver and gold must be expected and managed as part of our investment risk management process. Commodity and equity derivatives are readily available to help achieve a sensible smoothing of returns.
- High price volatility for silver and gold is rooted in production cost economics for gold and copper (silver is often produced as a by-product of gold and copper mining), capex economics for AI and electrification, and both trackable and less-transparent physical inventory movements through commodity exchanges and the balance sheets of producers, consumers, and merchants, as well as retail channels.
- Silver took the leadership baton from gold in June 2025 and will likely remain the stronger performer into the cyclical peak (Quicksilver gets quicker: long silver trade is now activated, 5-Jun-2025). With high conviction, we expect to see silver’s spot price advance to $65 and beyond in 2026.
- Operating leverage will cause the price returns of a global diversified basket of miners to outperform commodity price returns by a factor of 2x to 3x. We project 25% increases in silver and gold prices within the next 14 months. By implication, instruments like the Van Eck Gold Miners ETF (GDX) retain 50% upside potential or more over the same interval despite already extraordinary YTD performance. GDX has advanced by +137.0% YTD (Oct 21) for better than top percentile performance (99.1%-ile, Oct 21) relative to the members of the S&P 500.
This material is published by Blacklight Research, LLC (“Blacklight”) for informational, educational, and institutional research purposes only. All content has been compiled and presented as general market commentary and non-personalized research, without regard to the investment objectives, financial condition, risk tolerance, hedging needs, regulatory status, tax position, or other circumstances of any particular company, institution, fund, account, or individual. Nothing in this material is intended as, and nothing should be construed as, investment advice, trading advice, commodity trading advice, hedging advice, legal advice, tax advice, accounting advice, or any other form of individualized professional advice. This material is not an offer, solicitation, recommendation, endorsement, or invitation to buy, sell, subscribe for, hedge, or otherwise transact in any security, commodity, futures contract, option, swap, derivative, currency, index product, physical cargo, commercial contract, or other financial or commercial instrument. Any companies, securities, commodities, futures, options, swaps, contracts, indices, or strategies referenced herein are discussed solely for illustrative, analytical, or informational purposes. Blacklight is an independent publisher. Blacklight is not a broker-dealer, investment adviser, commodity trading advisor, commodity pool operator, futures commission merchant, introducing broker, swap dealer, or security-based swap dealer. Blacklight does not manage client assets, direct trading in securities or commodity interests, maintain discretionary authority over any account, execute or clear securities, futures, swaps, or other transactions, or provide individualized or customized investment, trading, hedging, or risk-management advice. Users are solely responsible for their own investment, trading, hedging, commercial, and risk-management decisions and actions, including any independent assessment of suitability, risk, liquidity, valuation, regulatory constraints, and legal obligations. Blacklight’s publications include macroeconomic analysis, commodity and market commentary, forward-looking assessments, geopolitical analysis, sector research, and other forms of substantive institutional research designed to assist clients in forming their own independent investment and commercial judgments. Blacklight’s publications may constitute research services that institutional clients may evaluate for eligibility under Section 28(e) of the Securities Exchange Act of 1934, subject to each client’s own good-faith determination and applicable law. Blacklight does not determine any client’s eligibility for Section 28(e) treatment and makes no representation that any client’s use of Blacklight research will qualify for such treatment. The information and opinions presented herein are based on data, market prices, company materials, government and regulatory publications, industry sources, news reports, third-party databases, proprietary data services, and other sources Blacklight deems to be reliable. Blacklight uses such sources in accordance with applicable license terms where relevant. Blacklight does not, however, make any representation, warranty, assurance, or guarantee, express or implied, as to the completeness, accuracy, timeliness, reliability, suitability, or availability of any information contained herein. Data may be incomplete, delayed, revised, restated, mis-transcribed, misinterpreted, or superseded. Any estimates, calculations, conversions, forecasts, scenarios, probabilities, and forward-looking assessments are based on assumptions that may prove incorrect and are subject to material uncertainty. The views expressed herein reflect Blacklight’s interpretations as of the date of publication and are subject to change without notice. All pricing, market data, and positioning data are as of the latest closing date prior to publication unless otherwise stated. Blacklight has no obligation to update, supplement, or revise this material after publication, or to notify any reader if any information, opinion, forecast, scenario, or assumption changes; however, Blacklight may, in its discretion, correct material errors that it identifies. Past performance is not necessarily indicative of future performance, and future results may differ materially from any historical performance, forecast, estimate, scenario, or projection discussed herein. Unless otherwise disclosed in the relevant publication, Blacklight and its principals, employees, contractors, or affiliates may hold positions in securities, commodities, futures, options, swaps, currencies, physical commodities, issuers, sectors, or instruments discussed, and such positions may change without notice. For this publication, Blacklight and the author(s) have disclosed any material financial conflicts they are aware of as of publication. No part of the compensation of any Blacklight analyst is determined by the specific views expressed in any publication or in any public or private meeting with clients. Trading, investing, hedging, or transacting in securities, commodities, futures, options, swaps, physical energy products, currencies, and related instruments involves substantial risk, including the possible loss of principal, liquidity risk, leverage risk, basis risk, volatility risk, counterparty risk, operational risk, regulatory risk, and the risk that market conditions change rapidly and unexpectedly. Commodity futures, options, swaps, and other derivatives may be unsuitable for many market participants and can involve losses exceeding initial margin or investment. Any discussion of hedging or risk management is general in nature and should not be interpreted as advice to implement or refrain from implementing any hedge, trade, or strategy. Any trade, shipment, financing, hedging, investment, commercial activity, or contractual arrangement involving affected regions, cargoes, vessels, counterparties, issuers, commodities, or instruments may be subject to sanctions, export controls, import controls, maritime law, market rules, exchange rules, position limits, anti-money-laundering rules, anti-corruption laws, and other legal or regulatory requirements. Readers are responsible for obtaining their own legal, regulatory, tax, accounting, compliance, and commercial advice before taking any action. This material may discuss war, terrorism, sanctions, geopolitical conflict, maritime incidents, physical infrastructure damage, or other events with serious human, security, and humanitarian consequences. Such discussion is included solely for the purpose of analyzing potential market, economic, commercial, and policy implications. Blacklight does not intend to minimize human suffering, endorse any political or military action, or attribute responsibility beyond the sources and analysis cited or described in the relevant publication. Blacklight is not liable for any loss, damage, cost, expense, or other consequence arising directly or indirectly from reliance on this material or any other content published by Blacklight. Blacklight’s research is published broadly and contemporaneously to clients and is not tailored to specific portfolio needs. Publications are distributed electronically by email and through website portals; delivery times may vary due to factors beyond Blacklight’s control. Blacklight does not provide client-specific versions of its publications, preferential access to unpublished research, or individualized follow-up advice tailored to any subscriber’s portfolio, trading book, hedging program, risk limits, tax position, or commercial exposure. This material is for the recipient’s personal or institutional internal use only and may not be copied, reproduced, modified, excerpted, distributed, redistributed, forwarded, posted, transmitted, or otherwise shared, in whole or in part, without Blacklight’s prior written consent. Cover art, charts, graphics, tables, photographs, and other visual materials are Blacklight intellectual property, generated materials, licensed content, public-domain content, or materials otherwise used in accordance with applicable law. All rights are reserved.