
Atlas Gasped

For a generation, the global natural gas market has been three regional champions striving to become one colossus. It’s been nearly fifteen years since we first argued that a new global gas trading architecture could link American supply and Asian demand to resolve European debt (Will U.S. natural gas save the world?, 15 November 2011). Until 2016, Henry Hub did its work in continental isolation, throttled by pipeline geography and the seasonal rhythm of U.S. storage. TTF cleared the European premium for whatever Russian molecules survived politics. JKM marked the oil-linked price at which Northeast Asian utilities would outbid the rest of the world for incremental cargoes. The three benchmarks occasionally corresponded, then drifted and diverged, with no physical mechanism reliably forcing them to clasp. That rolling equilibrium broke on March 18, when Iranian missiles destroyed Trains 4 and 6 at Ras Laffan and the Pearl GTL complex. The atlas of global gas no longer rests on three pillars. It rests on two hands: U.S. Gulf liquefaction running flat-out, and European storage caverns running on empty. Everything else in the price structure follows from that.
Atlas Gasped
Qatar exported 81 mtpa in 2025, accounting for nearly 20 percent of global LNG supply and 2.7 percent of global gas demand, according to IGU data. The country’s prewar plan was to reach 142 mtpa by 2030. The two destroyed trains alone represent 12.8 mtpa, or roughly 16 percent of Qatari export capacity, sidelined for a repair horizon QatarEnergy itself estimates at three to five years. But the supply losses are more consequential than the damaged trains. On March 4, Energy Minister Saad al-Kaabi declared force majeure on QatarEnergy's entire LNG output following a March 2 missile strike on Ras Laffan and Iran’s de facto blockade of the Strait of Hormuz, which forced the entire Qatari export complex offline. The force majeure has recently been extended from June to July 2026.
Two Qatari LNG tankers successfully crossed the Strait this week (Al Kharaitiyat on May 9, Mihzem on May 11), the first such transits since February, as Iran permitted them to cross to Pakistan on a case-by-case basis to supply an ally who is spearheading the peace process. But the trade route will remain offline as long as Hormuz cannot be safely transited by Q-Max and Q-Flex carriers. Ships large enough to move Qatari volumes economically cannot run a gauntlet when a civilian Indian vessel (MSV Haji Ali) was fired upon and sunk off the coast of Oman by an unknown attacker as recently as two days ago.
So, the practical loss to the market is not 16 percent of Qatari capacity but the full ~20 percent of global LNG supply until Hormuz reopens, with a multi-year tail risk if the trains do not come back. Cumulative Qatari LNG not loaded since February 28 now exceeds 16 million tonnes, a volumetric loss equivalent to about a quarter of European consumption over the same window. That figure grows by roughly 1.5 million tonnes per week that Hormuz remains closed. Barrels never loaded cannot be unloaded, and tonnes never liquefied cannot be regasified.
Into this hole, U.S. LNG has been bid to the technical limit of what the system can produce. Feedgas to the nine major U.S. terminals reached an all-time daily record of 20.2 Bcf/d on March 16 and has surpassed 20.0 Bcf/d on three subsequent days since then, according to Bloomberg data. April flows averaged 19.6 Bcf/d (+3.3 Bcf/d YoY) and May flows have averaged 17.7 Bcf/d to date (+2.5 Bcf/d YoY) in the shoulder season, with monthly EIA data putting March exports at 17.9 Bcf/d (94 percent utilization), the second-highest monthly figure on record after December 2025 at 18.4 Bcf/d.
EIA's April projections marked full-year 2026 LNG exports up 0.6 Bcf/d from the prior forecast to 17.0 Bcf/d rising to 18.6 Bcf/d in 2027 (trimmed to 18.2 Bcf/d this week) from a base at 15.1 Bcf/d in 2025, with operators deferring maintenance to capture pricing economics, according to Energy Intelligence. Operators do not defer maintenance lightly; the netbacks must dwarf the option cost of an unscheduled outage. Using Bloomberg data, we calculate that the TTF–Henry Hub spread averaged $14.87/MMBtu in March, up 84 percent month-on-month. The JKM–Henry Hub spread averaged $15.23/MMBtu, up 98 percent month-on-month. These spreads have pulled back in the shoulder season to $13.09 and $14.12, respectively MTD in May, but compare to $7.80 and $7.82 in the same period a year ago. At these spreads, every available U.S. molecule is being moved.
The supply equations on the U.S. side get more strained from here. U.S. LNG peak nameplate capacity rises to 19.3 Bcf/d this month according to EIA, against feedgas already running 18.7 Bcf/d on the 30-day average by Bloomberg’s tracking. Golden Pass Train 1 reached first LNG on March 30 and dispatched its first cargo on April 22. It will ramp up to 0.8 Bcf/d over the coming months, with Golden Pass Train 2 (also 0.8 Bcf/d) expected to come online in 2H2026. Corpus Christi Stage 3 Train 5 is at substantial completion, with Trains 6 and 7 soon to follow. The Department of Energy granted a 0.5 Bcf/d non-FTA export authorization increase to Plaquemines LNG in March and a 0.1 Bcf/d increase to Elba Island in April, bringing total long-term non-FTA export volume authorizations to 56.3 Bcf/d across 44 long-term authorizations, in a reversal of the Biden Administration’s “LNG pause” in 2024.
All in, operational expansions add 2.25 Bcf/d of nameplate liquefaction capacity in calendar year 2026. The next material increment of capacity, Port Arthur Phase 1, Rio Grande Trains 1 and 2, and Golden Pass Train 3, is a 2027 story totaling 4.12 Bcf/d of additional peak capacity. As these projects activate in the context of the global supply losses from Qatar, the U.S. is a bid-to-utilization market with one knob to turn, and that knob is domestic price.
We expect dry gas production to grow by less than 3 Bcf/d in 2026 and by about 3.5 Bcf/d in 2027 for cumulative supply growth of less than 6.5 Bcf/d, with the Permian providing the marginal increment via takeaway capacity additions in 2H2026, led by the Blackcomb (2.5 Bcf/d) and Hugh Brinson Phase 1 (1.5 Bcf/d) projects, supplemented by the Gulf Coast Express expansion (0.57 Bcf/d).
That production and pipeline growth, set against incremental LNG draw of 3.5 Bcf/d, pipeline export growth of 0.5 Bcf/d, and baseline domestic demand growth of 2.5 Bcf/d over the same two-year interval, leaves a domestic balance with little slack for either a hot summer or a cold winter. This domestic tightening was identifiable before the first missile struck Ras Laffan; the war is accelerating unmasking of it.
Into this already tight space for maneuverability, meteorologists now warn that this year is on track with a two-thirds probability to bring the strongest El Niño event since the 1870s, according to a prominent forecaster at the University of Albany. NOAA Climate Prediction Center and ECMWF also forecast a strong El Niño though are more cautious about estimating its eventual full intensity based on its current stage of development. Forecasts of Pacific sea surface temperatures 3 to 4 degrees Celsius above normal imply powerful but uncertain consequences for Saharan dust storms, Atlantic hurricane activity, crop production, and air conditioning demand across the United States. It’s safe to say, however, that the bias is to a hotter summer and more volatile physical conditions.
Producers Are Marking Up Their AI Gas Demand Forecasts
The incremental call on U.S. gas supply from new AI-oriented data centers will compete with export channels on the margin. This factor deserves a further word because the consensus model still tends to discount it. Hyperscalers' announced 2026 capex now exceeds $725 billion, up from a $365 billion forecast made less than twelve months ago. Roughly 25 GW of world data center capacity is scheduled for 2026 commissioning, with U.S. share falling between 50 and 60 percent, according to JLL. We believe at least 7 GW will energize on schedule in the United States, implying power feedstock demand worth about 1 Bcf/d equivalent, with natural gas accounting for at least 0.5 Bcf/d.
If this assessment is correct, then consensus expectations for 0.3 Bcf/d growth in the power segment are roughly half what they should be. Range Resources had previously told investors to expect 2.5 Bcf/d of incremental U.S. gas demand from data centers by decade's end. The outlook in the company’s latest presentation deck (Apr 21, page 17) now doubles that number to ~5 Bcf/d. This assessment is consistent with the outlook that we introduced nearly a year ago after listening to the speakers at the LDC Gas Forum Northeast (Boston, June 9-11, 2025). After sorting for phantom projects and delays and cancellations caused by shortages in supply chains for electrical and power generation equipment, we peg baseline growth at between 4 and 6 Bcf/d. Our base case assumes that approximately 780 GW in raw interconnection requests and announcements translates to 130 to 150 GW of actual commercial funnel with 60 GW delivered in the United States by decade’s end.
The behind-the-meter share is growing fastest, which matters volumetrically because behind-the-meter peakers run as high as 10 to 11 MMBtu per MWh heat rates against 6.8 for the combined-cycle plants the grid normally calls. A single 1 GW data center burning behind-the-meter consumes at least 0.235 Bcf/d, less than 1 percent of Appalachia's daily production but a sizable customer at the basin level when Marcellus pipeline takeaway is already constrained. Texas alone is on track for an incremental 12 to 15 GW of data center load by 2030. PJM faces a parallel buildout against 25 GW of planned coincident coal retirements, although in the wake of the historic April 2025 Iberian Peninsula blackout, the Department of Energy has been slow-walking coal retirements to diminish the risk of a comparable event striking the United States.
The cost of building a new combined-cycle gas turbine in the United States has risen to between $2,000 and $2,450 per kW, from less than $1,500 three years ago, according to EIA. Backlogs in gas turbines and other equipment are materially extending project development timelines. The hardware shortage compounds the gas-burn lock-in: hyperscalers are signing twenty-year fuel commitments because turbine queues are the binding constraint, not fuel availability.
The Second Hand: Europe’s Shaky Grip
European storage is the other hand on the atlas, and it is the shakier grip. According to the official AGSI database maintained by GIE, EU underground gas stocks stood at 35.8 percent of storage capacity on May 14, down 7.8 percentage points from the same date a year ago and 13.0 points below the five-year average. Storage bottomed at 27.7 percent on March 31, the lowest coverage since Russia invaded Ukraine during the 2022 winter and second-lowest since the all-time low in April 2018. The European Commission has already blinked: its March 23 letter to EU capitals formally relaxes the refill level for next winter to 80 percent from the previously mandated 90 percent, shifts the rigid November 1 deadline to a window between October 1 and December 1, and reclassifies intermediate milestones in February, May, and July as indicative.
These adjustments are an acknowledgement that Europe cannot reach 90 percent by November 1 without paying prices that destroy industrial demand on a scale that would be politically uncontainable. To frame in physical units based on the AGSI data for storage and capacity, Europe enters injection season needing to add roughly 51 bcm to reach even 80 percent, or approximately 8.5 bcm per month of net injections against a working capacity that is mechanically constrained. The 90 percent target would have required more than 10 bcm per month.
This unresolved tightness is why TTF has held above €40 per MWh through all but one reported step toward a U.S.-Iran truce and every announcement of LNG cargo redirection from Asia to Europe. The prompt Jun-26 contract surged past €51.05 yesterday, equivalent to $17.39/MMBtu, with the curve sitting in an unusual backwardation that is overpowering the seasonals. TTF transited a €13.11 price range over the past month with an average at €44.76 per MWh, the kind of intra-month vol that signals a market that has not found its clearing level. Whatever happens to the prompt over the next forty days, the primary question for European gas now is what TTF 4Q2026 price clears 50+ bcm of summer injections against a global supply curve that has lost its single largest swing exporter.
In Asia, spot JKM in mid-April slumped to $15.00 per MMBtu (April 17) from highs above $22 (March 19) on the false dawn of a Hormuz reopening and is now trading at a discount to TTF (–$0.28 per MMBtu) that has rarely persisted in modern global gas history. In a normally functioning market with Qatar online, JKM trades at a premium to TTF to clear Pacific demand. In the three years before the Iran war, this premium averaged +6.6 percent (+$0.70). Inversion last happened on a sustained basis in the year following Russia’s invasion of Ukraine and averaged –10.9 percent (–$5.64).
The current JKM-TTF inversion has just begun, but it is a firm price signal that European buyers are paying up to divert cargoes that would otherwise discharge in Tianjin, Yokohama, and Incheon. Korean and Japanese utilities are taking the lower JKM print as a cue to draw down their own inventories rather than chase Europe's bid, a strategy that works for one summer and breaks if North Asia has a cold November. In China, soft industrial demand and the secondary tariff regime have kept Chinese LNG imports subdued, but a 1 million tonne per year swing in Chinese restocking would arrive in a global market with no inventory to give.
The tightening trajectory distributes its consequences unevenly across the Atlantic. For the U.S. independent E&P with Haynesville, Marcellus, or Eagle Ford dry gas exposure, the setup is the cleanest fundamental tailwind the sector has had since 2008: production growth of less than +6.5 Bcf/d in 2026-27 against +6.5 Bcf/d of demand on normal weather and conservative assumptions is a textbook call on equity multiples, not just basis differentials. For European industrials in petrochemicals, fertilizers, ceramics, glass, and aluminum, the same molecule delivers the opposite verdict: at TTF above €50, marginal capacity in Germany, Italy, and Northwestern Europe is strained, and BASF, Yara, and the European chlorine majors have already lowered offtake since Russia's invasion of Ukraine first sent local gas prices higher. The American producer and the European manufacturer are on opposite sides of the same regime change, and the spread between their equity re-ratings will widen as long as the atlas rests on two hands rather than three.
For U.S. utilities and IPPs with merchant gas-fired generation, the rising domestic strip is partially offset by power price pass-through but combined-cycle dispatch economics into late summer 2026 deserve more scrutiny than they are getting from any analyses that treat the recent soft prompt prices as normal and the emerging bottoms in the forward strips as the temporary anomaly. Here we would spotlight the Apr-26 U.S. CPI data published on May 12 by BLS: retail electricity prices are 6.1 percent higher YoY and utility piped gas advanced by 3.0 percent YoY even on softer-than-normal shoulder-season pricing in the wholesale market.
For U.S. LNG terminal operators (Cheniere, Venture Global, Sempra), the current wide TTF and JKM spreads do not yield a sudden spot windfall, because 85 to 95 percent of capacity in this industry is locked into fixed-fee, take-or-pay tolling contracts. Instead, the real economic catalyst is that these high international prices are driving creditworthy global utilities to aggressively sign new 20-year contracts, allowing operators to secure Final Investment Decisions (FIDs) for next-generation expansion trains, structurally expanding long-term free cash flow and dividend growth profiles in a way the equity market has yet to fully price in.
Pricing Reality: Physical Cash Markets Will Lift NYM Gas Strips
Set against these structural drivers, what is the NYM curve pricing? The prompt Jun-26 contract settled yesterday at $2.96, in a solid advance from its contract all-time low ($2.59, Apr 30) in two years of active trading. The signal in this price inflection should be heeded as shoulder season gives way to injection season. The twelve-month strip is now probing $3.40, up ten cents from its recent low two weeks ago. The curve is steeply contangoed from prompt to winter, with Jan-27 settling at $4.55 last night. Consensus opinion seems to believe summer remains soft, withdrawal season tightens significantly, and winter carries a war premium.
This is a reasonable shape under the old supply dynamics. Under conditions where European storage must refill from 28 percent toward 80+ percent over the injection window, where Asian buyers have entered competitive spot bidding for the cargoes Qatar cannot deliver, where U.S. liquefaction utilization is already near maximum, where a major climatic event lies immediately ahead, and where every new train commissioned through year-end converts into immediate incremental dry-gas pull, prompt price below $2.60 is structurally too low and the front-of-curve contango is too steep. This is the market pricing the supply side of the next ninety days. It is not adequately pricing the demand side of the next nine months. And that inadequacy is why it is changing now.
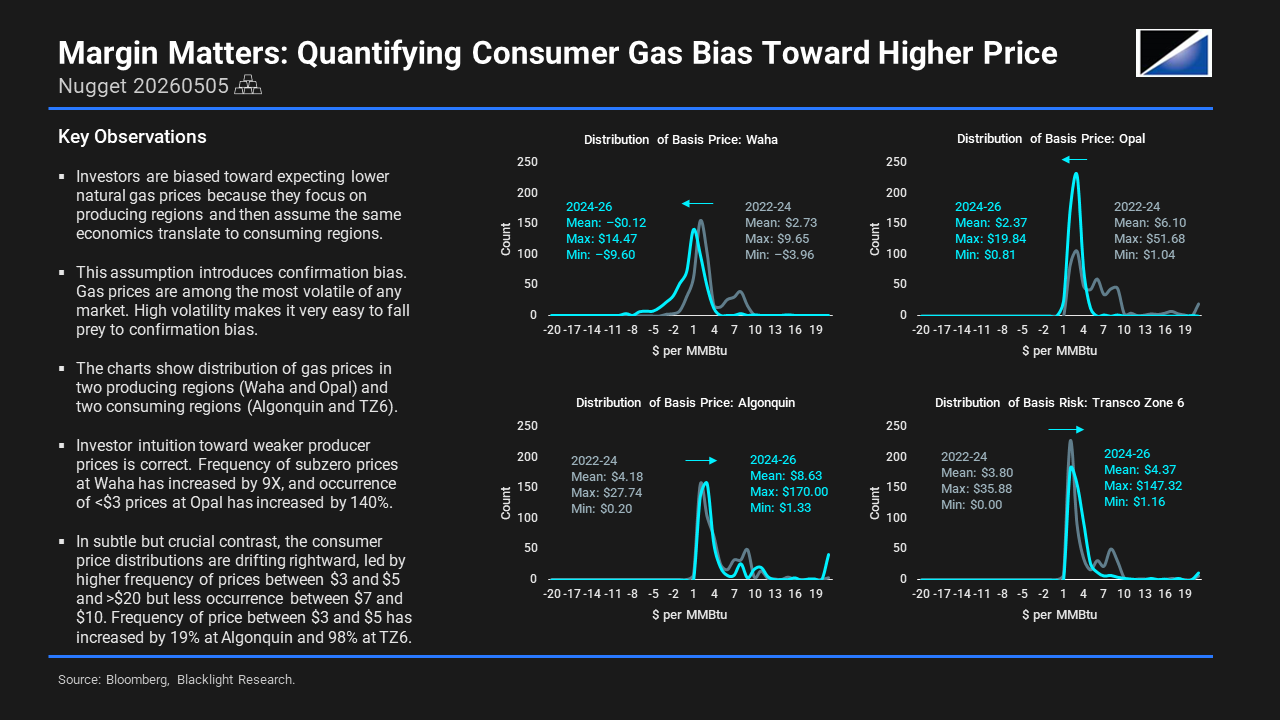
The Henry Hub 2026-27 winter strip (Nov-26 through Mar-27, or average prices across X6 through H7) is among the most underpriced assets in global gas at $3.87. This strip has retreated by 85 cents from the January high during the freeze-offs spurred by Winter Storm Fern to its lowest level since LNG capacity temporarily went down two weeks earlier. The market consensus has interpreted the post-Hormuz easing of prompt prices as a signal that gas is abundant and falling U.S. producer prices will pull all basis prices lower. This view correctly observes the downward bias in producer prices (including rising frequency of subzero prices at Waha Hub) but overlooks the subtle but detectable rightward drift in distributions of consumer prices that we have previously documented (Nugget 20260504 and Nugget 20260505).
A useful interrogation is to compare the EIA's own storage trajectory under its export forecast. The agency expects the U.S. to enter the next withdrawal season at 3,912 Bcf, which would represent a 7 percent surplus to the five-year average. That projection embeds 17.0 Bcf/d in average 2026 LNG exports and 1.5 Bcf/d in 2026 pipeline net exports. With YTD feedgas deliveries already averaging 19.1 Bcf/d before midyear and the export queue continuing to ramp, realized 2026 exports are on track to exceed EIA's annual number, all else equal.
Realized LNG exports somewhere between 17.5 and 18.0 Bcf/d, which appears achievable given current capacity utilization and the pace of new train startup, would imply an additional 180 to 350 Bcf of pull from inventory over the balance of the year. That math walks October 31 storage toward 3,560 to 3,730 Bcf, potentially as much as a 3 percent deficit versus the five-year average rather than the 7 percent expected surplus. The potential parallels to the sudden shift in 2026 oil balance expectations from glut to shortage are striking. Pair this with a normal-to-cool winter and the Jan-27 futures price at $4.55 looks far too low to clear the market without significant rationing of industrial or power-sector demand. The vol surface concurs: on Bloomberg marks, 25-delta skew on the Jan-27 contract favors the calls by +8.4-vols and the 58.8 percent implied volatility pairs with a strike at $6.95.
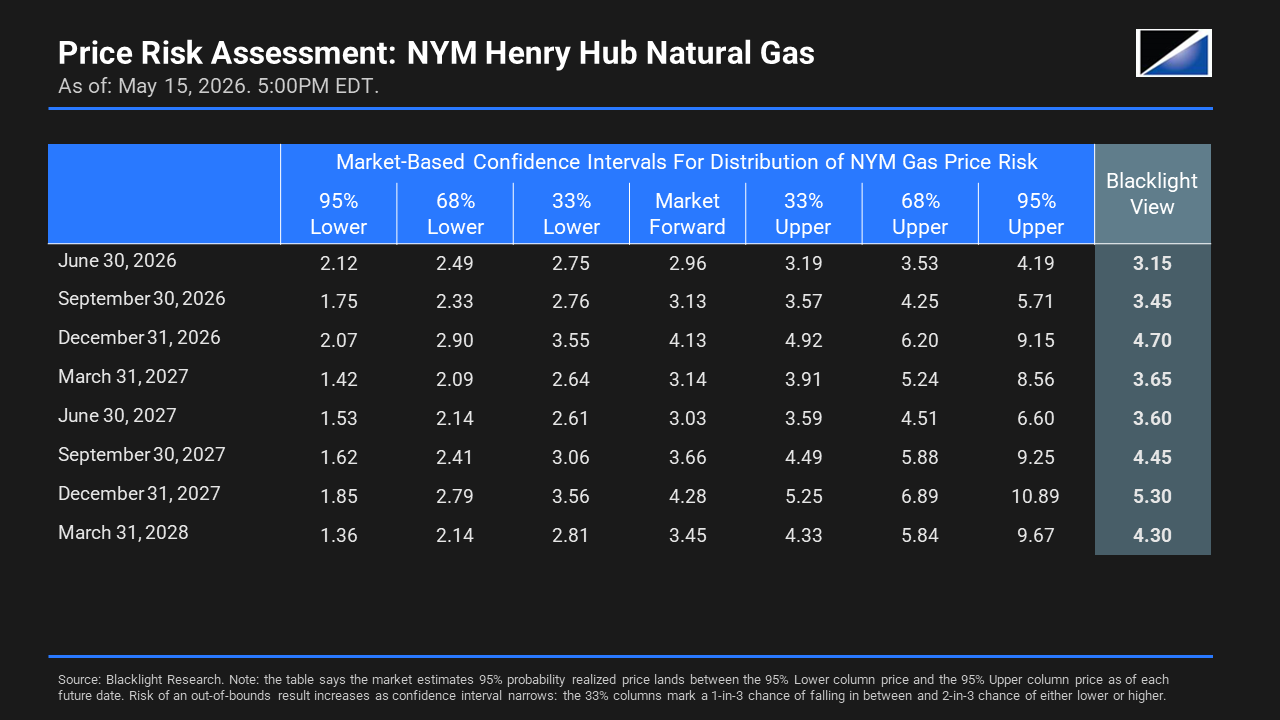
Europe enters next winter needing to defend 80 percent storage levels with Qatar still offline. U.S. feedgas in November 2026 will face the simultaneous claim of European refill, Northeast Asian winter procurement, and U.S. residential heating demand, against a domestic balance in deficit. The 2026-27 winter strip is likely sitting on its lows and will likely move back to or above the $4.40 average price posted during the year through March 30, 2026. Prompt Jun-26 rolls off in two weeks (May 27), which will make N6 ($3.12, May 15) the new prompt price.
For the corporate hedger on the consumer side, the implications are straightforward. Anyone with European gas-buying obligations through winter 2026-27 will be examining whether they are underwriting a tail risk that does not need to be carried. The TTF 4Q2026 and 1Q2027 contracts offer protection at levels that, if Qatar fails to return on the optimistic three-year timeline, will likely look like good value in eighteen months. On the U.S. side, industrial gas consumers in chemicals, refining, and power generation will be reviewing hedging strategies for their winter 2026-27 burns now, at strip prices that are unlikely to be available again.
For the institutional investor, long NYM natural gas strips are the most direct instrument for expressing the thesis, with the underlying contracts collectively offering exposure to El Niño, European refill, and data center capex without the headline risk that the Hormuz news cycle delivers daily to the prompt. For equity expression, a basket of LNG exporters offers operational leverage to global LNG netbacks, while a basket of domestic producers offers leverage to the domestic price tightening.
Investors should also be aware that the Bloomberg Commodity Index is structurally underweight global gas relative to the asset's current importance in the macro landscape, and BCOM-tracking flows are unlikely to provide the marginal bid that other commodity moves have historically enjoyed. The bid will have to come from discretionary capital identifying the opportunity.
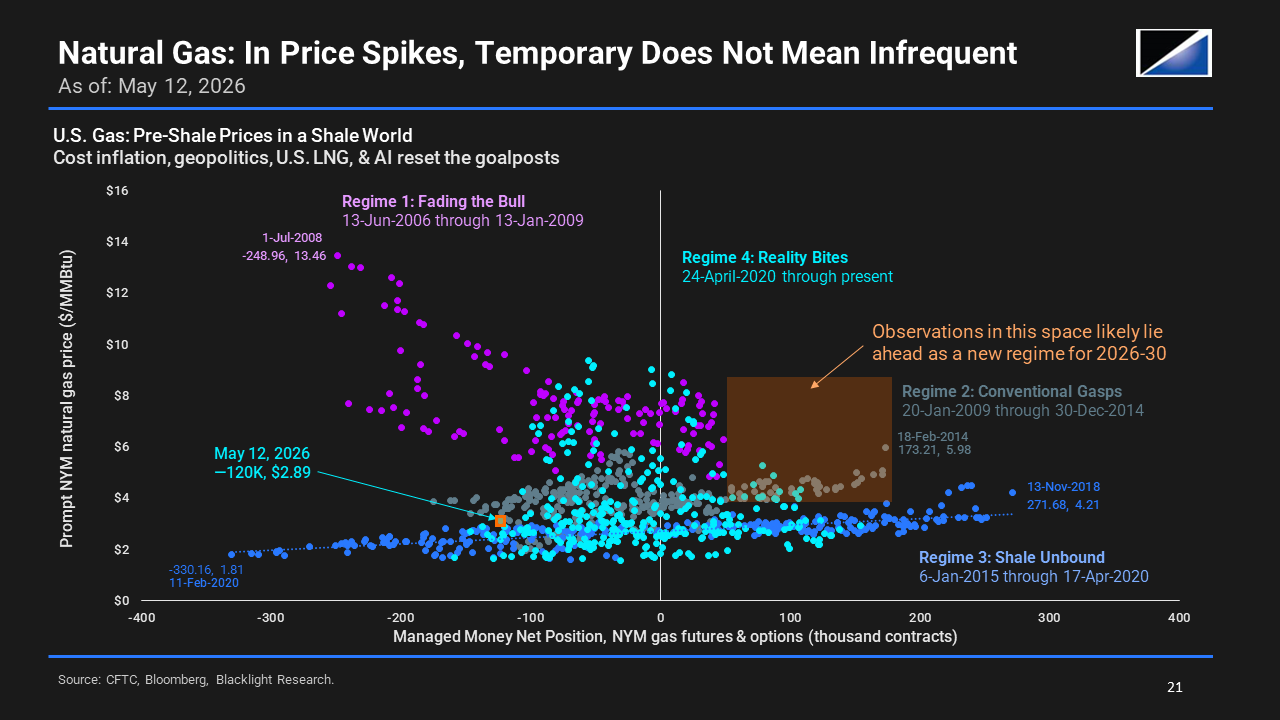
In the chart below, this will manifest as observations beginning to drift toward the empty spaces to the right of the vertical line, as the managed money community moves to net length in NYM gas futures and options. This movement will likely feel “wrong” at first to investors grown too accustomed to the space largely occupied to the lower left of the vertical for the past twenty years. Such is the nature of regime changes: experience becomes a Promethean chain, binding investors to a past paradigm while the market shifts beneath them.
The risks to the Atlas Gasped thesis are not the ones the consensus narrative is currently focused on. The headline risk (a sudden U.S.-Iran ceasefire, Hormuz reopens, Qatari LNG resumes) is in fact the smaller risk to the trade. Even a complete cessation of hostilities tomorrow does not bring Trains 4 and 6 back online. QatarEnergy’s three-to-five-year repair horizon is the binding physical constraint. A ceasefire restores Qatari shipping access and brings perhaps 60 to 65 percent of Qatari capacity back to market within two to three quarters, which is bullish for relief but leaves a structural deficit through 2028.
The larger risk to the thesis is on the demand side. A meaningful global recession in 2H2026 (triggered perhaps by the cumulative effect of $150+ refined product prices, too restrictive monetary policy, and tariff-driven trade contraction) would compress European industrial gas demand by 8 to 12 percent, sufficient to ease the storage refill enough that prompt TTF could test €30 even with Qatar out. We assign no more than 20 percent to this scenario, and even if it occurred, the 2026-27 winter strip in U.S. natural gas would be defended by the structural draw on domestic balances from LNG export growth that does not pause for global GDP.
A second demand risk is a mild winter in both Europe and Northeast Asia in 2026-27, which would compress the seasonal premium we expect to emerge. We assess this chance at about 30 percent, and again it affects the prompts more than the structural strips.
The third demand risk is regulatory: an emergency European Commission demand-rationing order in late summer 2026 that effectively backs out 5 to 10 bcm of industrial consumption could blunt the price signal needed to clear the storage refill. Reactionary policy has happened recurrently in Europe since 2022 and is more likely than the two other risks. We assess this scenario at 35 percent probability. However, we view it not as a denial of the bull case but as the mechanism by which the bull case is realized at lower headline prices than would otherwise obtain.
On the supply side, the principal counterargument is that $4+ Henry Hub reactivates a shale gas supply response large enough to close the gap. We do not disagree with this basic premise: it’s why the center of the fairway for our projected gas price channel is at $4 to $5 instead of $8 to $10. But there is a question of timing and origin: spare molecules looking for a home are more likely to arrive later and through associated gas production. The capital discipline regime that public E&Ps adopted after 2020, the depletion of drilled-but-uncompleted inventory across the Haynesville and Appalachia, and the 18-to-24-month lag between price signal and first production make a 2018-style supply surge structurally unlikely within the time frame of this thesis. The gas will come, but not before the winter strip reprices.
The mechanism that defeats the thesis entirely (Qatari repairs completing in eighteen months rather than three to five years, with simultaneous Hormuz reopening and Asian demand collapse) would be a miraculous confluence that we assess at less than 5 percent.
The deeper analytical point is that global natural gas has crossed into a new regime. For a decade, gas was the swing fuel of the energy transition narrative, the bridge between coal and renewables, the commodity that markets treated as abundant, and policymakers treated as expendable. That regime ended on March 18. The new regime is one in which gas is recognized as the irreplaceable enabler of every gigawatt of dispatchable power, every chemical feedstock, every petrochemical molecule, every winter heating load, and every air-conditioned data center between Frankfurt and Osaka.
Atlas Gasped is the gas chapter of the Abandoned Alpha thesis: the civilizational transformation now underway runs on electricity, and dispatchable power growth at scale relies on gas turbines until scalable fusion arrives. The market is in the early stages of pricing what it means to have lost 20 percent of the world's seaborne gas trade to a war that may end this year and may not, with two destroyed trains that will not produce a molecule until 2029 at the earliest. The 2026-27 winter strip in U.S. natural gas is the instrument that prices this regime change most cleanly and is currently priced as if the regime change has not occurred. We believe the repricing has already begun.
This material is published by Blacklight Research, LLC (“Blacklight”) for informational, educational, and institutional research purposes only. All content has been compiled and presented as general market commentary and non-personalized research, without regard to the investment objectives, financial condition, risk tolerance, hedging needs, regulatory status, tax position, or other circumstances of any particular company, institution, fund, account, or individual. Nothing in this material is intended as, and nothing should be construed as, investment advice, trading advice, commodity trading advice, hedging advice, legal advice, tax advice, accounting advice, or any other form of individualized professional advice. This material is not an offer, solicitation, recommendation, endorsement, or invitation to buy, sell, subscribe for, hedge, or otherwise transact in any security, commodity, futures contract, option, swap, derivative, currency, index product, physical cargo, commercial contract, or other financial or commercial instrument. Any companies, securities, commodities, futures, options, swaps, contracts, indices, or strategies referenced herein are discussed solely for illustrative, analytical, or informational purposes. Blacklight is an independent publisher. Blacklight is not a broker-dealer, investment adviser, commodity trading advisor, commodity pool operator, futures commission merchant, introducing broker, swap dealer, or security-based swap dealer. Blacklight does not manage client assets, direct trading in securities or commodity interests, maintain discretionary authority over any account, execute or clear securities, futures, swaps, or other transactions, or provide individualized or customized investment, trading, hedging, or risk-management advice. Users are solely responsible for their own investment, trading, hedging, commercial, and risk-management decisions and actions, including any independent assessment of suitability, risk, liquidity, valuation, regulatory constraints, and legal obligations. Blacklight’s publications include macroeconomic analysis, commodity and market commentary, forward-looking assessments, geopolitical analysis, sector research, and other forms of substantive institutional research designed to assist clients in forming their own independent investment and commercial judgments. Blacklight’s publications may constitute research services that institutional clients may evaluate for eligibility under Section 28(e) of the Securities Exchange Act of 1934, subject to each client’s own good-faith determination and applicable law. Blacklight does not determine any client’s eligibility for Section 28(e) treatment and makes no representation that any client’s use of Blacklight research will qualify for such treatment. The information and opinions presented herein are based on data, market prices, company materials, government and regulatory publications, industry sources, news reports, third-party databases, proprietary data services, and other sources Blacklight deems to be reliable. Blacklight uses such sources in accordance with applicable license terms where relevant. Blacklight does not, however, make any representation, warranty, assurance, or guarantee, express or implied, as to the completeness, accuracy, timeliness, reliability, suitability, or availability of any information contained herein. Data may be incomplete, delayed, revised, restated, mis-transcribed, misinterpreted, or superseded. Any estimates, calculations, conversions, forecasts, scenarios, probabilities, and forward-looking assessments are based on assumptions that may prove incorrect and are subject to material uncertainty. The views expressed herein reflect Blacklight’s interpretations as of the date of publication and are subject to change without notice. All pricing, market data, and positioning data are as of the latest closing date prior to publication unless otherwise stated. Blacklight has no obligation to update, supplement, or revise this material after publication, or to notify any reader if any information, opinion, forecast, scenario, or assumption changes; however, Blacklight may, in its discretion, correct material errors that it identifies. Past performance is not necessarily indicative of future performance, and future results may differ materially from any historical performance, forecast, estimate, scenario, or projection discussed herein. Unless otherwise disclosed in the relevant publication, Blacklight and its principals, employees, contractors, or affiliates may hold positions in securities, commodities, futures, options, swaps, currencies, physical commodities, issuers, sectors, or instruments discussed, and such positions may change without notice. For this publication, Blacklight and the author(s) have disclosed any material financial conflicts they are aware of as of publication. No part of the compensation of any Blacklight analyst is determined by the specific views expressed in any publication or in any public or private meeting with clients. Trading, investing, hedging, or transacting in securities, commodities, futures, options, swaps, physical energy products, currencies, and related instruments involves substantial risk, including the possible loss of principal, liquidity risk, leverage risk, basis risk, volatility risk, counterparty risk, operational risk, regulatory risk, and the risk that market conditions change rapidly and unexpectedly. Commodity futures, options, swaps, and other derivatives may be unsuitable for many market participants and can involve losses exceeding initial margin or investment. Any discussion of hedging or risk management is general in nature and should not be interpreted as advice to implement or refrain from implementing any hedge, trade, or strategy. Any trade, shipment, financing, hedging, investment, commercial activity, or contractual arrangement involving affected regions, cargoes, vessels, counterparties, issuers, commodities, or instruments may be subject to sanctions, export controls, import controls, maritime law, market rules, exchange rules, position limits, anti-money-laundering rules, anti-corruption laws, and other legal or regulatory requirements. Readers are responsible for obtaining their own legal, regulatory, tax, accounting, compliance, and commercial advice before taking any action. This material may discuss war, terrorism, sanctions, geopolitical conflict, maritime incidents, physical infrastructure damage, or other events with serious human, security, and humanitarian consequences. Such discussion is included solely for the purpose of analyzing potential market, economic, commercial, and policy implications. Blacklight does not intend to minimize human suffering, endorse any political or military action, or attribute responsibility beyond the sources and analysis cited or described in the relevant publication. Blacklight is not liable for any loss, damage, cost, expense, or other consequence arising directly or indirectly from reliance on this material or any other content published by Blacklight. Blacklight’s research is published broadly and contemporaneously to clients and is not tailored to specific portfolio needs. Publications are distributed electronically by email and through website portals; delivery times may vary due to factors beyond Blacklight’s control. Blacklight does not provide client-specific versions of its publications, preferential access to unpublished research, or individualized follow-up advice tailored to any subscriber’s portfolio, trading book, hedging program, risk limits, tax position, or commercial exposure. This material is for the recipient’s personal or institutional internal use only and may not be copied, reproduced, modified, excerpted, distributed, redistributed, forwarded, posted, transmitted, or otherwise shared, in whole or in part, without Blacklight’s prior written consent. Cover art, charts, graphics, tables, photographs, and other visual materials are Blacklight intellectual property, generated materials, licensed content, public-domain content, or materials otherwise used in accordance with applicable law. All rights are reserved.