
Dr. Copper Is Trying To See You Now

Executive Summary
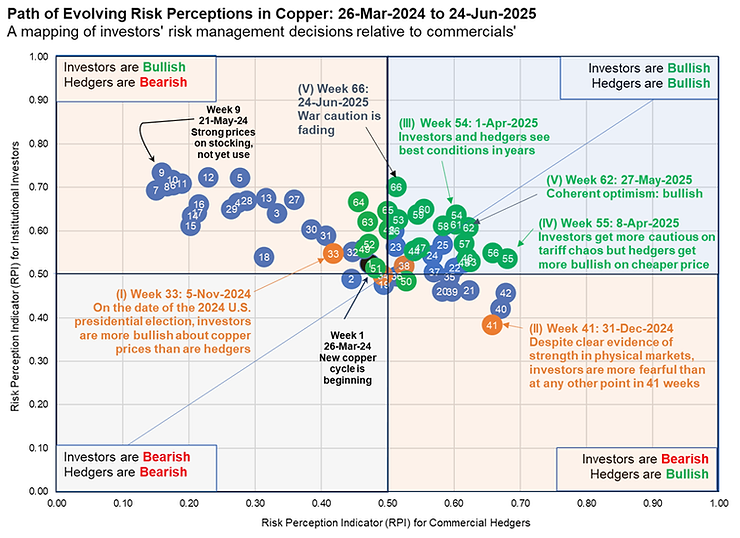
- Coming into 2025, our investment strategy to own copper futures and to own the Global X Copper Miners ETF (COPX) was, surprisingly, a contrarian call. By December 2024, investors had become more bearish toward copper prices than at any other point in the prior two years. However, we were confident the data supported the bull case. As we spotlighted at the time, fundamentals in the physical copper markets were rapidly strengthening. Also, our analysis of commercial hedging flows assessed this well-informed cohort’s perception of copper price risk was at the most bullish level in a year and was getting more bullish. (Buy copper, 27-Aug-2024; Physical copper is flashing buy signs, even in China, 17-Dec-2024; Copper investors fear China tail risks; physical merchants report calmer waters, 5-Jan-2025, Nine commodity markets in ninety seconds, 10-Jan-2025; Listen to copper, 10-Feb-2025).
- In the event, here at midyear 2025, LME cash copper has advanced by +16.9% YTD to reach $10,119 per mt, or $4.59 per lb. (Jun 27). The now-prompt Jul-25 copper futures contracts listed at the three major copper exchanges in Shanghai, London, and New York have advanced by +7.8%, +12.3%, and +23.5%, respectively. The Global X Copper Miners ETF has returned +17.6% YTD (Jun 27), beating 83% of the S&P 500. Owning copper is definitively working on both an absolute and relative basis.
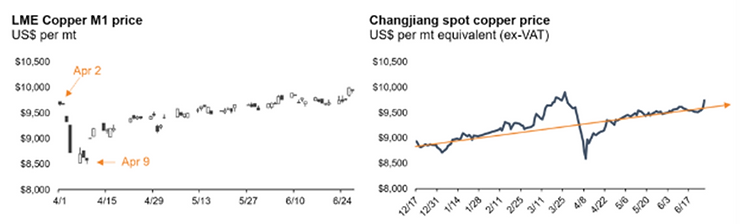
- To be sure, copper did shudder briefly in the tariff-spurred growth scare of April 2025. If the Trump Administration had not moved to calm panicked markets on April 9, a darker scenario for copper could have emerged. But the 90-day pause for most new tariffs did happen, and copper never signaled recession as the most likely outcome according to our real-time analysis of physical data and options activity over the past three months. Instead, the fear-fueled drawdown in copper was completed in just one week (Apr 9). Spot copper recovered to its Apr 2 level on May 14 and made a fresh YTD high at $10,200 on June 26.
- The 90-day extension period ends on July 9. This date looms as an imminent risk event that could go poorly for economic activity and for copper if Trump Administration policy is too inflexible with respect to that deadline. However, we expect dealmaking and pragmatism to prevail. We read Canada’s decision to scrap its digital services tax on U.S. tech firms as a positive catalyst for negotiations with America’s second-largest trading partner. Mexico and China have already moved to placate U.S. complaints. In constructing our baseline copper and other commodity forecasts, we assume (1) the universal 10% tariffs remain in effect, (2) countries that move to negotiate with the U.S. will be granted further extensions and leniency, and (3) flexibility will characterize the U.S. dealmaking posture so long as progress is made on achieving trade goals.
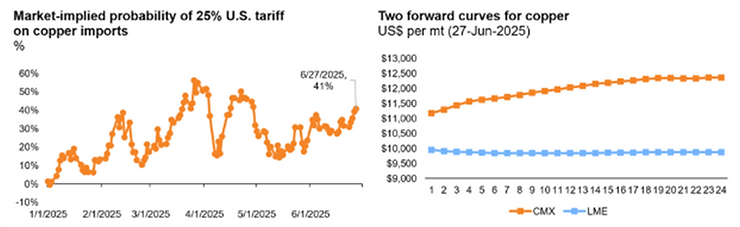
- With moderate confidence, we do expect a Section 232 tariff (25%) to be applied to U.S. copper imports by 1Q2026, further justifying the materially different shapes of the forward curves for CMX copper (upward sloping) and LME copper (downward sloping). But if we are wrong on Section 232, the net effect will simply be for CMX futures prices to move lower and back in line with the LME and SFE futures curves in a rising market for spot price over time. This relative value setup leaves us preferring to place long futures positions in the LME curve, not the CMX curve.
- The copper cycle now underway began in February 2024. We believe copper will most likely continue to strengthen for at least three more years in what we expect, more broadly, to be one of the strongest environments for commodity markets in decades. We maintain our high-conviction call to own copper, which now ranks #3 among all commodities on relative fundamentals in the systematic Commodity Conditions Index (CCI) framework, trailing only platinum and silver (CCI scores, 30-Jun-2025).
- Our baseline year-end price forecast for LME cash copper is $10,600 per mt ($4.81 per lb). We view this target as conservative given it would mark an advance of just +5% over current cash prices. Think of this as acknowledging there has been some front-loading of copper demand into 1H2025. But we don’t want to get too complacent about that front-loading either. Given ongoing strategic stockpiling and the upside risks for stronger end use of refined metal, we estimate a 40% probability for cash price to exceed $11,000 at the year-end tenor, about a 15% chance of exceeding $12,500, and only 6% odds for the scenario of ending the year below $8,500. This risk skew strongly favors overweight net long strategies in copper. Investors who have fought a wall of worry in copper should understand it is not too late to get involved. Wounded portfolios looking for relief should hear clearly: Dr. Copper is trying to see you now.
Commentary
Coming into this year, commodity investor sentiment toward copper was at a ten-month low despite rapidly strengthening physical market fundamentals and the strongest commercial sentiment in the same interval, as revealed by our measurements in Risk Perception Indices (RPIs, chart below). Equity investors were even more pessimistic toward the sector. At then-current spot prices of $4 per lb., calls for $3 copper were not common, but we did field a few inquiries about the chance of $3 happening. We warned this dour sentiment was a misread of risk and a contrarian indicator that should be exploited (Buy copper, 27-Aug-2024; Physical copper is flashing buy signs, even in China, 17-Dec-2024; Copper investors fear China tail risks; physical merchants report calmer waters, 5-Jan-2025; Nine commodity markets in ninety seconds, 10-Jan-2025).
Source: Blacklight Research.
Squaring this divergence in perception between paper investors and physical hedgers required noticing that the global copper market is transforming through novel and evolving demand growth patterns, structural changes in the industrial organization of supply (e.g., an historic shift in smelting treatment charges), and new incentives for trade and inventory management at both the corporate and sovereign levels (Listen to copper, 10-Feb-2025). Successful investing in copper over the next five years is vitally dependent on understanding how China’s role in the 2020s cycle will likely differ materially from its role in the cycle of nearly a generation ago (2000s).
Investors had anticipated select aspects of these bullish factors in 2023 but were premature in embracing a too glib “supercycle” thesis that paid insufficient attention to scrap supply. As always in markets, timing is everything. As we said in spring 2023 (A barrel in hand is worth two in the balance, 19-Mar-2023) through summer 2023 (We take stock of our commodity trading ideas, 1-Jun-2023) and into that autumn (Copper is in trouble, 19-Sep-2023), one needs to be extremely careful trying to trade five-year forward expected global balances (e.g., 2028) through a benchmark instrument whose name is, literally, the “LME three-month price” (e.g., Jul-2023, or LPN23). Five years vs. three months: that’s an unavoidable timing problem. Likewise, investing in perpetual securities (e.g., shares of copper miners) on assumptions of a summer 2023 inventory “stock out” that is expressly prohibited by the rules of a futures exchange is unlikely to work as expected.
Add on top of those stressors the idiosyncratic operational risks always at work in metal and mining cycles. In this cycle, operational problems have already frustrated smooth performance by First Quantum Minerals Ltd. (Cobre Panama, 2023), Freeport McMoRan, Inc. (Grasberg and Manyar, 2024-25), Ivanhoe Mines Ltd. (Kamoa-Kakula, 2025), and Teck Resources Ltd. (Carmen de Andacollo and Quebrada Blanca, 2025). Equity investors overexposed to any or all these idiosyncratic risks will understandably hold a “once bitten, twice shy” caution toward copper. But it is crucial for investors not to interpret the copper sector solely through single-name stocks. We need to see the global macro view of the global copper industry in its entirety, which is more visible through the performance of commodity futures and broad basket ETFs.
As the first half of 2025 nears completion, the fact is Jul-25 copper futures prices have advanced by +7.8%, +12.3%, and +23.5% YTD in Shanghai, London, and New York, respectively. The Global X Copper Miners ETF (COPX) that we have spotlighted since August 2024 as the best broad vehicle for owning global copper industry cost-curve economics has advanced by +17.6% YTD through June 27, beating 83% of the S&P 500. Owning copper is one of the strongest-performing investment strategies in 1H2025 on both an absolute and relative basis, even as Ivanhoe and others have stumbled.
Looking forward, copper now ranks 3rd strongest of 36 commodities in the Commodity Condition Index (CCI) framework that rates commodities through a systematic and consistent algorithmic processing of global fundamentals (not opinions from us). We maintain that copper futures and COPX are to be owned in 2H2025 and beyond.
Key fundamental levers include:
- Accelerating world demand: world refined copper usage grew by +2.8% (+749 kmt) in 2024 and accelerated to +3.3% in the first four months of 2025, according to data published last week by the International Copper Study Group (ICSG). While some of this growth reflects front-loaded demand pull from 2H2025 to evade expected U.S. tariffs, we expect only a modest summer slowdown. Contrary to consensus forecasts of a reversion toward +2.5% growth for 2025, we project full-year growth in 2025 closer to +3.1%, resulting in a modest 113 kmt surplus that is likely to flip to deficit in 2026. Over the second half of this decade, we anticipate further acceleration to a +4% to +5% CAGR. Powerful demand growth for data centers and for electricity from the artificial intelligence (AI) sector will require grid modernization, new power infrastructure buildout, and sizable investment in copper-intensive equipment. Likewise, the electric vehicle and renewable energy sectors will require substantial quantities of copper.
- Constrained global mine supply: Copper mine supply is already struggling to keep up with demand due to a structural decline in ore grades and a dwindling pipeline of new mine projects. Average ore grade for producing mines has fallen from more than 1.0% copper content twenty-five years ago to about 0.6% copper content today, according to BHP. Reserve grades are even weaker, now averaging closer to 0.4% copper content. World copper mine production grew by +2.8% in 2024 and slowed to +2.1% in the first four months of 2025, according to ICSG.
- Operational difficulties: Significant mine production problems have plagued the copper industry in 2025. Nearly half a million tonnes of output have been pulled out of this year’s balance. The flooding at the Kamoa-Kakula project in the Democratic Republic of Congo alone accounts for about 150 to 160 kmt of this foregone supply. A nationwide power outage in Chile in February knocked out nearly 100 kmt of Codelco’s production across its Chuquicamata, Andina, Salvador, and El Teniente mines.
- Cost inflation at the mine face: brownfield project capital intensity for projects with capacity greater than 50 kmt per year has increased from an average $14,000/tpa across 25 projects between 2010 and 2015 to $23,000/tpa across 10 projects between 2020 and 2025, according to BHP citing data from Wood Mackenzie. The same source reports average capital intensity for two brownfield projects coming online between 2025 and 2030 is nearly $33,000/tpa.
- Smelter rationalization: China’s smelter capacity has boomed but utilization has buckled on the scarcity in concentrates to process. China’s smelter capacity growth rate has outpaced its domestic mine production growth rate by a factor of more than two to one since 2020 according to data from the China Nonferrous Metals Industry Association. Though economic losses have first forced closures of smelters outside of China (e.g., Glencore’s PASAR smelter in the Philippines), unprofitable excess smelting capacity in China is now also running at significantly reduced utilization rates, in turn trimming refined production rates. World refinery capacity utilization averaged 82.7% in the first four months of 2025 versus 86.0% in the same period a year ago.
- Scrap recycling has run its course as a “red lasso” constraining primary prices: world secondary refined copper production amounted to 1.578 million tonnes in the first four months of 2025, according to the latest ICSG data. This output marks an increase of +3.1% over the same period a year ago. However, we assess that scrap availability is tightening rapidly after the powerful, price-spurred supply surges in 2023 (+336 kmt, +8.1%) and 2024 (+223 kmt, +5.0%). Secondary production as a share of total world refined production increased from 16.4% in 2022 to 17.1% in 2024. In 2025, the ratio is averaging closer to 16.8% and falling.
- Low and falling SFE and LME exchange inventories: Deliverable copper inventories at the Shanghai Futures Exchange (SFE) are at 81,550 metric tonnes (Jun 27), close to the lowest levels of the past 15 months. The current level marks a draw of 186,787 mt (-70%) since 28-Feb-2025. While LME on-warrant copper stocks have built modestly in the past few weeks, they are also far lower than at year’s start. The current 57,650 mt compares to 252,050 mt on 31-Dec-2024. In noteworthy contrast, total copper inventory in CMX warehouses is above 209 thousand short tons and rising, as premium pricing in New York continues to draw inventory into the United States.
- Tariff risk increases with tenor: By our calculations, CMX-LME price spreads imply the market sees about a 40% to 50% probability of Section 232 tariffs being applied before summer’s end. This assessment is down from 55% in the week before Liberation Day (Apr 2) but has been steadily increasing from 14% on May 14. Looking further out in time, the market appears to be discounting about 80% odds of Section 232 tariffs on U.S. copper imports at the one-year forward mark and 93% at the two-year mark. The elevated likelihood of U.S. tariffs on copper continues to produce markedly different shapes for the CMX and LME forward curves (charts below).
- Strategic stockpiling is large and expanding, as consumers can see the tightening in available supply: Corporate entities are driving the copper stockpiling into the United States. Inflows exceeded 255 kmt in 1Q2025 and 625 kmt in 2Q2025, with June 2025 registering the largest one-month copper imports into the U.S. on record (about 275 kmt), according to complied data from Reuters, Kpler, and the U.S. government. These inflows have been so abnormally large, they helped drive a contraction in the headline U.S. GDP growth figure for 1Q2025. However, be aware that the sovereign government of China is also accumulating copper inventories as strategic reserves. In March 2025, the National Development and Reform Commission (NDRC) announced it would “move faster to fulfil the yearly task of stockpiling strategic goods”, according to reporting by Bloomberg. Price inquiries have been made by the National Food and Strategic Reserves Administration, again according to Bloomberg.
- In this cycle, China’s main change agent role is a supply side factor, not a demand side factor. The emergence of subzero fees for treatment charges and the recently concluded negotiations between Antofagasta and Chinese smelters for contracted zero TCs signal a historic shift to a new form of industrial organization between mining and smelting.
Source: Blacklight Research.
Implications for copper price risk
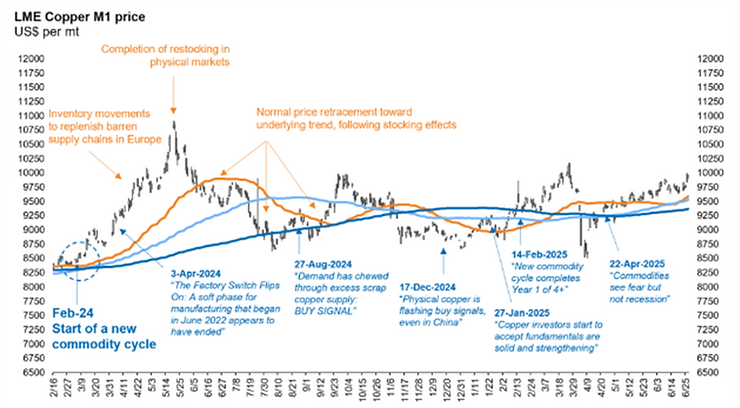
Copper entered a new bull cycle in February 2024. The first phase was characterized by aggressive inventory restocking to replenish depleted stores in Europe following its war-torn manufacturing recession (chart below). This replenishment period found the prices required to dislodge newly acquired stocks in China and divert them toward Europe. Once that restocking process was completed, prompt primary prices retraced to trend as underlying end use demand consolidated and strengthened. We watched that process in real time and assessed the restocking/retrending phase was complete by end of August 2024 (Buy copper, 27-Aug-2024).
Source: LME, Bloomberg, Blacklight Research. Solid lines are 50-day, 100-day, and 200-day moving averages.
Rising price validated this assessment until challenged, briefly, by the results of the U.S. presidential election of 2024. Following that election, commodity investors who had been carrying large, long copper futures positions, especially on COMEX, suddenly dumped them on the view “electrification is over” and “the energy transition is over”.
It is difficult to exaggerate how much this sudden change of heart overstated the degree to which electrification/transition assumptions were embedded in copper futures in the first place (e.g., ‘100% EVs by 2035’ was never a base case in copper futures) and thus what assumptions were available to remove from copper futures prices.
To the express contrary, the indiscriminate selling sent copper prices below their natural clearing level relative to supply and demand and spurred the inventory grab that became one of the hallmarks of copper prices in 1Q2025. In thirty years of watching markets, I can count on one hand the instances when I knew in real time that futures traders were engaging in herd behavior and making a large and clear-cut trading mistake against their self interest. In this instance, emotions about the outcome of the election clouded assessments of fundamentals and risk. Usually, there is far more scope for genuine uncertainty and dispassionate debate about current and future conditions.
Sure enough, copper prices quickly regrouped and advanced to fresh six-month highs on the eve of Liberation Day (Apr 2). Like most other global markets, copper futures then responded negatively to the Rose Garden ceremony and the math of its tariff placard. Copper sold off suddenly and hard (more than $1,000 per mt) as traders assessed the potential for a sudden shift into global recession. Copper prices were never consistent with 60% risk of recession, but we believe they briefly and correctly probed 35% to 45% odds. The fear-based selling persisted into April 9, when the Trump Administration successfully soothed panicked markets by granting a 90-day pause on implementation of most new tariffs. This date marked the YTD bottom in copper futures. Spot copper recovered to its Apr 2 level on May 14 and made a fresh YTD high at $10,200 on June 26. Prices are now tracking at or slightly above trend in both the futures and cash markets (chart below).
Source: LME, Antaike, Bloomberg, Blacklight Research.
Looking into the second half of the year, the 90-day tariff extension period is due to expire imminently (July 9). This date looms as a nearby risk event that could go poorly for economic activity and for copper if Trump Administration policy is too inflexible with respect to that deadline. However, we expect dealmaking and pragmatism to prevail. We read Canada’s decision to scrap its digital services tax on U.S. tech firms as a positive catalyst for negotiations with America’s second-largest trading partner. Mexico and China have already moved to placate U.S. complaints. In constructing our baseline copper and other commodity forecasts, we assume (1) the universal 10% tariffs remain in effect, (2) countries that move to negotiate with the U.S. will be granted further extensions and leniency, and (3) flexibility will characterize the U.S. dealmaking posture.
With moderate confidence (50%), we do expect a Section 232 tariff (25%) to be applied to U.S. copper imports by 1Q2026, further justifying the materially different shapes of the forward curves for CMX copper (upward sloping) and LME copper (downward sloping). But if we are wrong on Section 232, the net effect will simply be for CMX futures prices to move lower and back in line with the LME and SFE futures curves in a rising market for spot price over time. This relative value setup leaves us preferring to place long futures positions in the LME curve, not the CMX curve.
We believe copper will most likely continue to strengthen for at least three more years in what we expect, more broadly, to be one of the strongest environments for commodity markets in decades. We maintain our high-conviction call to own copper, which now ranks #3 among all commodities on relative fundamentals in the systematic Commodity Conditions Index (CCI) framework, trailing only platinum and silver (CCI scores, 30-Jun-2025).
Our baseline year-end price forecast for LME cash copper is $10,600 per mt ($4.81 per lb). We view this target as conservative given it would mark an advance of just +5% over current cash prices. Think of this as acknowledging there has been some front-loading of copper demand into 1H2025. But we don’t want to get too complacent about that front-loading either. Given ongoing strategic stockpiling and the upside risks for stronger end use of refined metal, we estimate a 40% probability for cash price to exceed $11,000 at the year-end tenor, about a 15% chance of exceeding $12,500, and only 6% odds for the scenario of ending the year below $8,500 (charts below). This risk skew strongly favors overweight net long strategies in copper. Investors who have fought a wall of worry in copper should understand it is not too late to get involved. Wounded portfolios looking for relief should hear clearly: Dr. Copper is trying to see you now.
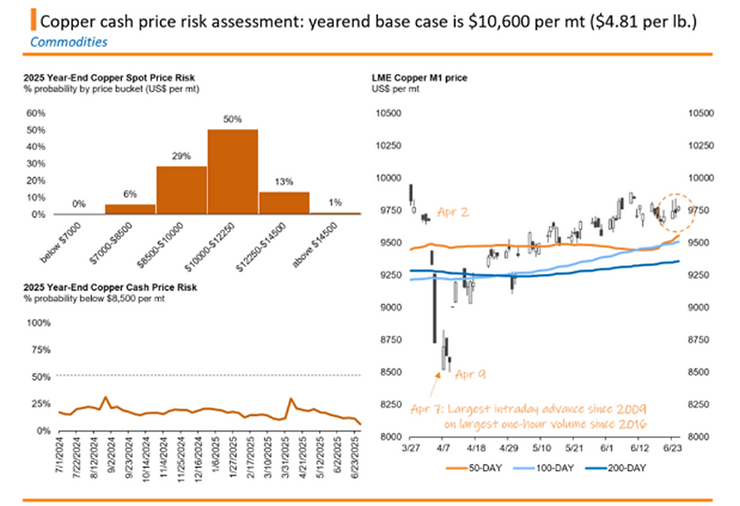
Source: Bloomberg, LME, Blacklight Research.
This material is published by Blacklight Research, LLC (“Blacklight”) for informational, educational, and institutional research purposes only. All content has been compiled and presented as general market commentary and non-personalized research, without regard to the investment objectives, financial condition, risk tolerance, hedging needs, regulatory status, tax position, or other circumstances of any particular company, institution, fund, account, or individual. Nothing in this material is intended as, and nothing should be construed as, investment advice, trading advice, commodity trading advice, hedging advice, legal advice, tax advice, accounting advice, or any other form of individualized professional advice. This material is not an offer, solicitation, recommendation, endorsement, or invitation to buy, sell, subscribe for, hedge, or otherwise transact in any security, commodity, futures contract, option, swap, derivative, currency, index product, physical cargo, commercial contract, or other financial or commercial instrument. Any companies, securities, commodities, futures, options, swaps, contracts, indices, or strategies referenced herein are discussed solely for illustrative, analytical, or informational purposes. Blacklight is an independent publisher. Blacklight is not a broker-dealer, investment adviser, commodity trading advisor, commodity pool operator, futures commission merchant, introducing broker, swap dealer, or security-based swap dealer. Blacklight does not manage client assets, direct trading in securities or commodity interests, maintain discretionary authority over any account, execute or clear securities, futures, swaps, or other transactions, or provide individualized or customized investment, trading, hedging, or risk-management advice. Users are solely responsible for their own investment, trading, hedging, commercial, and risk-management decisions and actions, including any independent assessment of suitability, risk, liquidity, valuation, regulatory constraints, and legal obligations. Blacklight’s publications include macroeconomic analysis, commodity and market commentary, forward-looking assessments, geopolitical analysis, sector research, and other forms of substantive institutional research designed to assist clients in forming their own independent investment and commercial judgments. Blacklight’s publications may constitute research services that institutional clients may evaluate for eligibility under Section 28(e) of the Securities Exchange Act of 1934, subject to each client’s own good-faith determination and applicable law. Blacklight does not determine any client’s eligibility for Section 28(e) treatment and makes no representation that any client’s use of Blacklight research will qualify for such treatment. The information and opinions presented herein are based on data, market prices, company materials, government and regulatory publications, industry sources, news reports, third-party databases, proprietary data services, and other sources Blacklight deems to be reliable. Blacklight uses such sources in accordance with applicable license terms where relevant. Blacklight does not, however, make any representation, warranty, assurance, or guarantee, express or implied, as to the completeness, accuracy, timeliness, reliability, suitability, or availability of any information contained herein. Data may be incomplete, delayed, revised, restated, mis-transcribed, misinterpreted, or superseded. Any estimates, calculations, conversions, forecasts, scenarios, probabilities, and forward-looking assessments are based on assumptions that may prove incorrect and are subject to material uncertainty. The views expressed herein reflect Blacklight’s interpretations as of the date of publication and are subject to change without notice. All pricing, market data, and positioning data are as of the latest closing date prior to publication unless otherwise stated. Blacklight has no obligation to update, supplement, or revise this material after publication, or to notify any reader if any information, opinion, forecast, scenario, or assumption changes; however, Blacklight may, in its discretion, correct material errors that it identifies. Past performance is not necessarily indicative of future performance, and future results may differ materially from any historical performance, forecast, estimate, scenario, or projection discussed herein. Unless otherwise disclosed in the relevant publication, Blacklight and its principals, employees, contractors, or affiliates may hold positions in securities, commodities, futures, options, swaps, currencies, physical commodities, issuers, sectors, or instruments discussed, and such positions may change without notice. For this publication, Blacklight and the author(s) have disclosed any material financial conflicts they are aware of as of publication. No part of the compensation of any Blacklight analyst is determined by the specific views expressed in any publication or in any public or private meeting with clients. Trading, investing, hedging, or transacting in securities, commodities, futures, options, swaps, physical energy products, currencies, and related instruments involves substantial risk, including the possible loss of principal, liquidity risk, leverage risk, basis risk, volatility risk, counterparty risk, operational risk, regulatory risk, and the risk that market conditions change rapidly and unexpectedly. Commodity futures, options, swaps, and other derivatives may be unsuitable for many market participants and can involve losses exceeding initial margin or investment. Any discussion of hedging or risk management is general in nature and should not be interpreted as advice to implement or refrain from implementing any hedge, trade, or strategy. Any trade, shipment, financing, hedging, investment, commercial activity, or contractual arrangement involving affected regions, cargoes, vessels, counterparties, issuers, commodities, or instruments may be subject to sanctions, export controls, import controls, maritime law, market rules, exchange rules, position limits, anti-money-laundering rules, anti-corruption laws, and other legal or regulatory requirements. Readers are responsible for obtaining their own legal, regulatory, tax, accounting, compliance, and commercial advice before taking any action. This material may discuss war, terrorism, sanctions, geopolitical conflict, maritime incidents, physical infrastructure damage, or other events with serious human, security, and humanitarian consequences. Such discussion is included solely for the purpose of analyzing potential market, economic, commercial, and policy implications. Blacklight does not intend to minimize human suffering, endorse any political or military action, or attribute responsibility beyond the sources and analysis cited or described in the relevant publication. Blacklight is not liable for any loss, damage, cost, expense, or other consequence arising directly or indirectly from reliance on this material or any other content published by Blacklight. Blacklight’s research is published broadly and contemporaneously to clients and is not tailored to specific portfolio needs. Publications are distributed electronically by email and through website portals; delivery times may vary due to factors beyond Blacklight’s control. Blacklight does not provide client-specific versions of its publications, preferential access to unpublished research, or individualized follow-up advice tailored to any subscriber’s portfolio, trading book, hedging program, risk limits, tax position, or commercial exposure. This material is for the recipient’s personal or institutional internal use only and may not be copied, reproduced, modified, excerpted, distributed, redistributed, forwarded, posted, transmitted, or otherwise shared, in whole or in part, without Blacklight’s prior written consent. Cover art, charts, graphics, tables, photographs, and other visual materials are Blacklight intellectual property, generated materials, licensed content, public-domain content, or materials otherwise used in accordance with applicable law. All rights are reserved.